1964 United States presidential election in North Carolina
|
|
| Turnout | 74%  |
|---|
| |  |  | | Nominee | Lyndon B. Johnson | Barry Goldwater | | | Party | Democratic | Republican | | Home state | Texas | Arizona | | Running mate | Hubert Humphrey | William E. Miller | | Electoral vote | 13 | 0 | | Popular vote | 800,139 | 624,844 | | Percentage | 56.15% | 43.85% | |
 County Results County Results 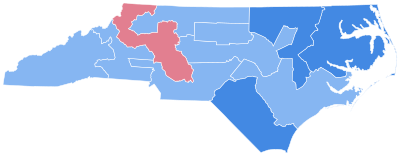 Congressional District Results Congressional District Results | Johnson 50-60% 60-70% 70-80% 80-90% | Goldwater 50-60% 60-70% | |
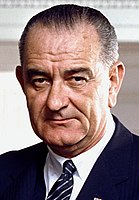
President before election
Lyndon B. Johnson
Democratic | Elected President
Lyndon B. Johnson
Democratic | |
The 1964 United States presidential election in North Carolina took place on November 3, 1964, and was part of the 1964 United States presidential election. Voters chose 13 representatives, or electors to the Electoral College, who voted for president and vice president.
Campaign
Polling initially showed Goldwater leading in North Carolina, but his farm policies, particularly his opposition to federal tobacco price support, hurt his campaign.
As of the 2020 presidential election[update], this is the last election when the following counties voted for a Democratic presidential candidate: Wayne, Moore, and Lenoir.[2]
Results
| 1964 United States presidential election in North Carolina[3] |
| Party | Candidate | Votes | Percentage | Electoral votes |
| | Democratic | Lyndon B. Johnson (incumbent) | 800,139 | 56.15% | 13 |
| | Republican | Barry Goldwater | 624,844 | 43.85% | 0 |
| Totals | 1,424,983 | 100.0% | 13 |
| Voter turnout | | — |
Results by county
| County[4] | Lyndon B. Johnson
Democratic | Barry Goldwater
Republican | Margin | Total |
| # | % | # | % | # | % |
| Alamance | 15,397 | 50.36% | 15,177 | 49.64% | 220 | 0.72% | 30,574 |
| Alexander | 3,722 | 49.75% | 3,760 | 50.25% | -38 | -0.50% | 7,482 |
| Alleghany | 2,368 | 60.09% | 1,573 | 39.91% | 795 | 20.18% | 3,941 |
| Anson | 4,144 | 70.66% | 1,721 | 29.34% | 2,423 | 41.32% | 5,865 |
| Ashe | 4,965 | 54.64% | 4,121 | 45.36% | 844 | 9.28% | 9,086 |
| Avery | 1,523 | 36.44% | 2,656 | 63.56% | -1,133 | -27.12% | 4,179 |
| Beaufort | 6,090 | 62.88% | 3,595 | 37.12% | 2,495 | 25.76% | 9,685 |
| Bertie | 3,332 | 78.16% | 931 | 21.84% | 2,401 | 56.32% | 4,263 |
| Bladen | 4,516 | 67.55% | 2,169 | 32.45% | 2,347 | 35.10% | 6,685 |
| Brunswick | 4,240 | 53.26% | 3,721 | 46.74% | 519 | 6.52% | 7,961 |
| Buncombe | 31,623 | 62.01% | 19,372 | 37.99% | 12,251 | 24.02% | 50,995 |
| Burke | 12,815 | 55.97% | 10,081 | 44.03% | 2,734 | 11.94% | 22,896 |
| Cabarrus | 11,921 | 47.50% | 13,178 | 52.50% | -1,257 | -5.00% | 25,099 |
| Caldwell | 10,846 | 55.40% | 8,733 | 44.60% | 2,113 | 10.80% | 19,579 |
| Camden | 870 | 61.97% | 534 | 38.03% | 336 | 23.94% | 1,404 |
| Carteret | 6,231 | 59.23% | 4,289 | 40.77% | 1,942 | 18.46% | 10,520 |
| Caswell | 2,513 | 58.36% | 1,793 | 41.64% | 720 | 16.72% | 4,306 |
| Catawba | 15,814 | 48.02% | 17,116 | 51.98% | -1,302 | -3.96% | 32,930 |
| Chatham | 5,295 | 56.29% | 4,111 | 43.71% | 1,184 | 12.58% | 9,406 |
| Cherokee | 3,823 | 55.90% | 3,016 | 44.10% | 807 | 11.80% | 6,839 |
| Chowan | 1,696 | 68.30% | 787 | 31.70% | 909 | 36.60% | 2,483 |
| Clay | 1,457 | 53.12% | 1,286 | 46.88% | 171 | 6.24% | 2,743 |
| Cleveland | 10,836 | 57.92% | 7,874 | 42.08% | 2,962 | 15.84% | 18,710 |
| Columbus | 9,004 | 66.82% | 4,471 | 33.18% | 4,533 | 33.64% | 13,475 |
| Craven | 7,422 | 61.27% | 4,691 | 38.73% | 2,731 | 22.54% | 12,113 |
| Cumberland | 13,864 | 60.39% | 9,093 | 39.61% | 4,771 | 20.78% | 22,957 |
| Currituck | 1,455 | 66.26% | 741 | 33.74% | 714 | 32.52% | 2,196 |
| Dare | 1,476 | 63.00% | 867 | 37.00% | 609 | 26.00% | 2,343 |
| Davidson | 13,735 | 44.27% | 17,292 | 55.73% | -3,557 | -11.46% | 31,027 |
| Davie | 3,086 | 40.90% | 4,460 | 59.10% | -1,374 | -18.20% | 7,546 |
| Duplin | 7,169 | 65.23% | 3,821 | 34.77% | 3,348 | 30.46% | 10,990 |
| Durham | 22,874 | 59.98% | 15,264 | 40.02% | 7,610 | 19.96% | 38,138 |
| Edgecombe | 7,834 | 66.58% | 3,932 | 33.42% | 3,902 | 33.16% | 11,766 |
| Forsyth | 31,615 | 51.08% | 30,276 | 48.92% | 1,339 | 2.16% | 61,891 |
| Franklin | 4,554 | 68.47% | 2,097 | 31.53% | 2,457 | 36.94% | 6,651 |
| Gaston | 20,197 | 54.11% | 17,129 | 45.89% | 3,068 | 8.22% | 37,326 |
| Gates | 1,702 | 75.38% | 556 | 24.62% | 1,146 | 50.76% | 2,258 |
| Graham | 1,737 | 55.41% | 1,398 | 44.59% | 339 | 10.82% | 3,135 |
| Granville | 4,596 | 63.66% | 2,624 | 36.34% | 1,972 | 27.32% | 7,220 |
| Greene | 2,712 | 75.06% | 901 | 24.94% | 1,811 | 50.12% | 3,613 |
| Guilford | 39,969 | 52.87% | 35,635 | 47.13% | 4,334 | 5.74% | 75,604 |
| Halifax | 8,952 | 65.30% | 4,757 | 34.70% | 4,195 | 30.60% | 13,709 |
| Harnett | 7,477 | 55.97% | 5,883 | 44.03% | 1,594 | 11.94% | 13,360 |
| Haywood | 10,664 | 65.67% | 5,575 | 34.33% | 5,089 | 31.34% | 16,239 |
| Henderson | 6,066 | 40.86% | 8,780 | 59.14% | -2,714 | -18.28% | 14,846 |
| Hertford | 3,953 | 79.91% | 994 | 20.09% | 2,959 | 59.82% | 4,947 |
| Hoke | 2,254 | 74.32% | 779 | 25.68% | 1,475 | 48.64% | 3,033 |
| Hyde | 1,127 | 68.68% | 514 | 31.32% | 613 | 37.36% | 1,641 |
| Iredell | 11,231 | 46.56% | 12,892 | 53.44% | -1,661 | -6.88% | 24,123 |
| Jackson | 4,905 | 60.65% | 3,183 | 39.35% | 1,722 | 21.30% | 8,088 |
| Johnston | 10,326 | 57.85% | 7,523 | 42.15% | 2,803 | 15.70% | 17,849 |
| Jones | 2,129 | 73.29% | 776 | 26.71% | 1,353 | 46.58% | 2,905 |
| Lee | 4,730 | 63.21% | 2,753 | 36.79% | 1,977 | 26.42% | 7,483 |
| Lenoir | 7,617 | 57.56% | 5,617 | 42.44% | 2,000 | 15.12% | 13,234 |
| Lincoln | 7,304 | 55.45% | 5,869 | 44.55% | 1,435 | 10.90% | 13,173 |
| Macon | 3,774 | 56.55% | 2,900 | 43.45% | 874 | 13.10% | 6,674 |
| Madison | 3,829 | 53.44% | 3,336 | 46.56% | 493 | 6.88% | 7,165 |
| Martin | 4,821 | 76.14% | 1,511 | 23.86% | 3,310 | 52.28% | 6,332 |
| McDowell | 6,314 | 60.20% | 4,174 | 39.80% | 2,140 | 20.40% | 10,488 |
| Mecklenburg | 49,582 | 51.56% | 46,589 | 48.44% | 2,993 | 3.12% | 96,171 |
| Mitchell | 1,736 | 34.73% | 3,263 | 65.27% | -1,527 | -30.54% | 4,999 |
| Montgomery | 3,933 | 53.74% | 3,385 | 46.26% | 548 | 7.48% | 7,318 |
| Moore | 6,384 | 55.29% | 5,162 | 44.71% | 1,222 | 10.58% | 11,546 |
| Nash | 9,163 | 58.89% | 6,396 | 41.11% | 2,767 | 17.78% | 15,559 |
| New Hanover | 12,584 | 50.90% | 12,140 | 49.10% | 444 | 1.80% | 24,724 |
| Northampton | 5,046 | 80.96% | 1,187 | 19.04% | 3,859 | 61.92% | 6,233 |
| Onslow | 5,955 | 61.23% | 3,771 | 38.77% | 2,184 | 22.46% | 9,726 |
| Orange | 9,206 | 61.41% | 5,785 | 38.59% | 3,421 | 22.82% | 14,991 |
| Pamlico | 1,864 | 64.30% | 1,035 | 35.70% | 829 | 28.60% | 2,899 |
| Pasquotank | 4,269 | 64.21% | 2,380 | 35.79% | 1,889 | 28.42% | 6,649 |
| Pender | 3,205 | 62.04% | 1,961 | 37.96% | 1,244 | 24.08% | 5,166 |
| Perquimans | 1,458 | 60.78% | 941 | 39.22% | 517 | 21.56% | 2,399 |
| Person | 4,740 | 68.68% | 2,162 | 31.32% | 2,578 | 37.36% | 6,902 |
| Pitt | 11,317 | 68.73% | 5,149 | 31.27% | 6,168 | 37.46% | 16,466 |
| Polk | 3,017 | 52.18% | 2,765 | 47.82% | 252 | 4.36% | 5,782 |
| Randolph | 10,638 | 43.64% | 13,739 | 56.36% | -3,101 | -12.72% | 24,377 |
| Richmond | 8,516 | 73.17% | 3,123 | 26.83% | 5,393 | 46.34% | 11,639 |
| Robeson | 13,796 | 79.35% | 3,591 | 20.65% | 10,205 | 58.70% | 17,387 |
| Rockingham | 11,432 | 55.78% | 9,063 | 44.22% | 2,369 | 11.56% | 20,495 |
| Rowan | 14,934 | 50.22% | 14,804 | 49.78% | 130 | 0.44% | 29,738 |
| Rutherford | 9,541 | 57.28% | 7,115 | 42.72% | 2,426 | 14.56% | 16,656 |
| Sampson | 8,067 | 51.38% | 7,634 | 48.62% | 433 | 2.76% | 15,701 |
| Scotland | 3,844 | 75.77% | 1,229 | 24.23% | 2,615 | 51.54% | 5,073 |
| Stanly | 7,931 | 47.05% | 8,924 | 52.95% | -993 | -5.90% | 16,855 |
| Stokes | 4,898 | 51.22% | 4,664 | 48.78% | 234 | 2.44% | 9,562 |
| Surry | 9,810 | 55.17% | 7,970 | 44.83% | 1,840 | 10.34% | 17,780 |
| Swain | 2,294 | 59.93% | 1,534 | 40.07% | 760 | 19.86% | 3,828 |
| Transylvania | 4,483 | 55.83% | 3,547 | 44.17% | 936 | 11.66% | 8,030 |
| Tyrrell | 996 | 72.70% | 374 | 27.30% | 622 | 45.40% | 1,370 |
| Union | 7,208 | 63.02% | 4,229 | 36.98% | 2,979 | 26.04% | 11,437 |
| Vance | 5,186 | 60.04% | 3,452 | 39.96% | 1,734 | 20.08% | 8,638 |
| Wake | 31,653 | 58.41% | 22,542 | 41.59% | 9,111 | 16.82% | 54,195 |
| Warren | 2,849 | 59.88% | 1,909 | 40.12% | 940 | 19.76% | 4,758 |
| Washington | 2,505 | 68.65% | 1,144 | 31.35% | 1,361 | 37.30% | 3,649 |
| Watauga | 4,031 | 50.62% | 3,932 | 49.38% | 99 | 1.24% | 7,963 |
| Wayne | 9,791 | 56.45% | 7,555 | 43.55% | 2,236 | 12.90% | 17,346 |
| Wilkes | 9,176 | 45.45% | 11,014 | 54.55% | -1,838 | -9.10% | 20,190 |
| Wilson | 7,238 | 59.13% | 5,002 | 40.87% | 2,236 | 18.26% | 12,240 |
| Yadkin | 3,638 | 38.30% | 5,860 | 61.70% | -2,222 | -23.40% | 9,498 |
| Yancey | 3,714 | 64.95% | 2,004 | 35.05% | 1,710 | 29.90% | 5,718 |
| Totals | 800,139 | 56.15% | 624,844 | 43.85% | 175,295 | 12.30% | 1,424,983 |
References
- ^ Sullivan, Robert David (June 29, 2016). "How the Red and Blue Map Evolved Over the Past Century". The National Catholic Review (America Magazine ed.).
- ^ Leip, Dave (2005). "1964 Presidential General Election Results — North Carolina". US Election Atlas. Retrieved July 22, 2011.
- ^ "NC US President Race, November 03, 1964". Our Campaigns.
Works cited
|
|---|
|
- See also
- Presidential elections
- Senate elections
- House elections
- Gubernatorial elections
|


 County Results
 Congressional District Results


